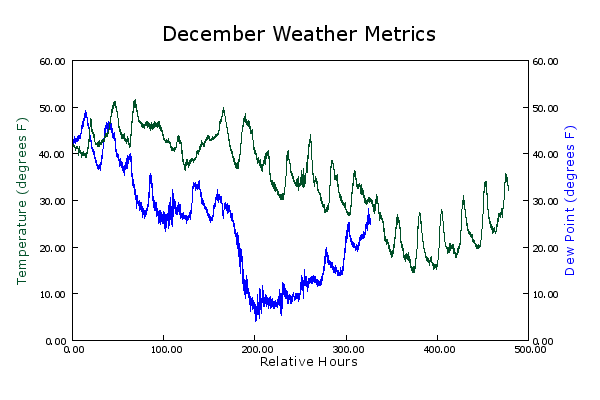
Simplot will make graphs that look like this:
using a command line interface that looks like this:
(let ((grn '(0 80 40))
(the-view (mk-view :view-bounds '(0 0 500 60))))
(plot2 "December Weather Metrics"
*hour-temp* the-view grn
:left "Temperature (degrees F)" grn :bottom "Relative Hours"
*time-dewp* the-view +blu+ :right "Dew Point (degrees F)" +blu+))
Simplot depends on the CL-GD package.
Download ASDF package from http://jandmworks.com/simplot/simplot.tgz
Documentation and examples can be found at http://jandmworks.com/simplot/user/simplot.html
Version 0.1 was released on 2010-01-02
This is an early release. There are known bugs and a list of features that still haven't been implemented. The user interface is not entirely stable at this point - suggestions, comments and any kind of feedback is welcome.
jeffrey at jandmworks dot com
Related packages: application, plotting, Mathematics